


Data Analysis Diploma
0 ج.س.
Description
Master Data Analysis and become analysis expert
This diploma is designed to equip participants with practical skills in data analysis and visualization using the most in-demand tools in the industry—Microsoft Excel, Power BI, and Tableau. The course focuses on transforming raw data into actionable insights to support decision-making processes in various sectors.
Enroll in Sudan’s leading Data Analysis Diploma and gain hands-on training in Excel, Power BI, and Tableau—perfect for professionals and graduates seeking data visualization, business intelligence, and data analytics certification.
Why Take This Course?
- Gain a well-rounded skill set combining three powerful tools: Excel, Power BI, and Tableau
- Learn how to automate reporting tasks and streamline data workflows
- Develop the ability to turn raw data into compelling visual stories
- Improve your decision-making skills using real-world data scenarios
- Build a portfolio of dashboards and analysis projects to impress employers or clients
- Get international-standard training tailored to the Sudanese job market
- Receive a recognized diploma certificate that adds value to your CV
- Enhance your ability to support organizational monitoring, evaluation, and performance tracking
- Ideal for both technical and non-technical professionals across industries
- A smart investment for freelancers, entrepreneurs, and career changers in data-focused roles
Course covered areas:
- Module 1: Microsoft Excel for Data Analysis
- Excel Fundamentals and Data Types
- Data Entry, Cleaning & Formatting
- Functions and Formulas (LOOKUP, IF, INDEX/MATCH, etc.)
- Pivot Tables & Charts
- Conditional Formatting
- Data Validation & Dynamic Dropdowns
- Dashboard Design using Excel
- Introduction to Macros
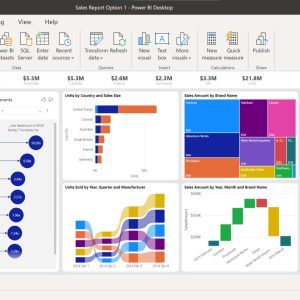
- Module 2: Power BI (20 Hours)
- Introduction to Power BI Interface
- Connecting to Data Sources
- Data Transformation using Power Query
- Creating Data Models and Relationships
- DAX (Data Analysis Expressions)
- Building Interactive Dashboards
- Sharing Reports on Power BI Service
- Module 3: Tableau (20 Hours)
- Introduction to Tableau Interface
- Connecting and Preparing Data
- Building Visualizations: Bar, Line, Map, Scatter, etc.
- Filters, Parameters, and Calculated Fields
- Creating Interactive Dashboards
- Storytelling with Data in Tableau
- Publishing and Sharing Dashboards
Who Should Enroll?
- Fresh graduates
- Monitoring and Evaluation Officers
- NGO and Development workers
- Working Professionals in roles like Business, finance, marketing, sales, operations, HR, Engineering, medical, IT or anyone who want to use data to support decision making.
- Entrepreneurs & Small Business Owners – who want to track performance and make data-informed decisions.
- Career Shifters – professionals looking to switch to data analysis, business intelligence, or reporting roles.
- Freelancers & Consultants – who need to deliver data-driven reports or dashboards to clients.
- Anyone seeking to enter the data analytics field
What Will You Learn?
- Perform advanced data analysis using Excel
- Build interactive dashboards with Power BI
- Create compelling data visualizations using Tableau
- Interpret and present data insights effectively
Course Details
- Duration: 80 Hours
- Language: The curriculum is in English, but the teaching method combines both Arabic & English
- Delivery Mode: Online / Classroom
- Certificate: Upon completion you will receive a certified diploma from Sudacad.
Why Learn with Sudacad?
- Expert trainers with real-world Excel experience
- Practical, hands-on learning
- Recognized certification
Recorded lectures available in Sudacad Telegram channel for online courses
Enroll Now : Click here
Only logged in customers who have purchased this product may leave a review.


Reviews
There are no reviews yet.